Another retro post from my Marketing Jive blog.
Original Post: July 2009 / Updated September 2016
The Difference Between a Dashboard and a Report
Ahh reporting… marketers live and die by reports, business’ live and die by reports, coaches live and get fired by reports. At some point in your life you will have measured and communicated success (or failure) in the form of a report or dashboard. We all use them, heck in the online marketing world we use them each an every day. So why then is there confusion by the masses over dashboards vs. reports? For whatever reason, there seems to be a lot of confusion over what a dashboard is and should consist of compared to that of which a report should consist of.
I think that we can agree that both dashboards and reports are used to communicate data and information. Yet dashboards and reports are and should be very different from one another. To understand this difference, let’s look at some of the definitions of each.
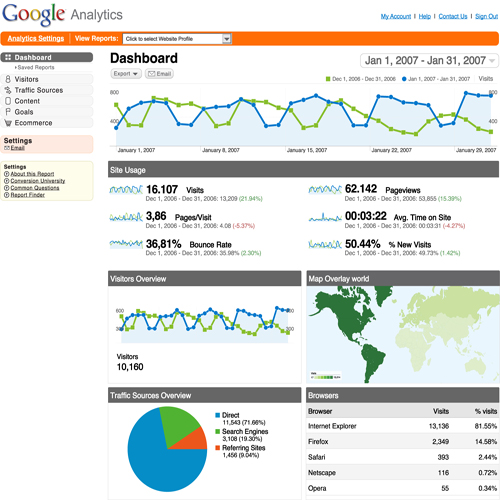
Definition of a Dashboard
According to Google, a dashboard is a two column webpage with four placeholder gadgets to make it easy to get started creating an overview of information.
Wikipedia’s definition for dashboard (construct) is a set of indicators that relate to the observable environment.
Perhaps one of the best definitions of a dashboard is from Stephen Few author of Information Dashboard Design –
“A dashboard is a visual display of the most important information needed to achieve one or more objectives which fits entirely on a single computer screen so it can be monitored at a glance.”
Web analytics master Avinash Kaushik suggests that 80% of Web Analytics dashboards are these excessive excel sheets that really do not tell us anything. They are not actionable. As Enquiro’s own web analytics expert John Yuill reminds us od something Avinash Kaushik points out:
dashboards empower a rapid understanding of business performance by tracking the critical business data in an easy to understand manner. Effective dashboards can be a very powerful communication medium and greatly accretive to driving actions. – Avinash Kaushik
There are some key components to this statement:
- easy to understand
- critical business data
- driving actions
Dashboards are meant to provide a quick indication as to the status of what is being measures. In an automobile a dashboard provides information on how much fuel you have left, or if there is anything mechanically wrong or how many bars of electricity you have left etc. The dame goes for online marketing dashboards, a dashboard should isolate key metrics, be simple and be visually appealing incorporating appropriate charts where necessary.
Definitions of Reports
Reports on the other hand are more detailed in nature. Reports tend to tell more of a story and as a result are more detailed in nature. Reports also take time to digest whereas a dashboard is meant to offer information in a quick manner. Reports can be used to communicate a number of items including:
- findings of a study or test
- representation of an account
- informing of an action or result caused by an action
- sharing of news
- filing of a complaint
- a composition for the purposes of education
Some common definitions of reports include:
From Princeton – a written document describing the findings of some individual or group
An account presented usually in detail. – Free Dictionary.com
a document characterized by information or other content reflective of inquiry or investigation – Wikipedia
So what are the main differences between a report and a dashboard?
- Dashboards are short and concise. Reports can be but are usually longer in nature.
- Dashboards are visual. Reports have visual components.
- Dashboards focus on specific KPIs. Reports include more background and data.
- Dashboards are meant to be monitored at a glance. Reports require more in-depth attention (i.e. require reading through)
- Dashboards communicate specifics. Reports often tell more of a story.
- Reports can include dashboards. Dashboards cannot or at least should not include a true report.
- Dashboards are simple. Reports tend to be more complex in nature.
- Dashboards are actionable. Reports can have actionable components.
From a number of “dashboards” and “reports” that I have seen out there, in the world of SEO and online marketing, there appears to be a disconnect with regards to reporting and dashboards. Quite often a new client comes to us and we ask to see some historical data, the client presents us with a plethora of data and lengthily reports. To gain an immediate understanding of how the client is performing all we need is to review simple and concise dashboards. The additional information in the form of the various reports can be beneficial, but we aim to get up to speed as soon as possible and do not always have the luxury of time to review all the minutiae of the reports. Dashboards can provide a great deal of information in a short period of time.
If you are concerned with the time it takes to complete your monthly, weekly or daily reporting, effective dashboards can help improve lean initiatives. Examine your dashboards and continue to revisit them. Are they concise, simple to digest and are they actionable? If not you probably have some work to do.